




A demo is a system running under conditions chosen to make it look good: a handful of devices, a clean network, an empty database, and one user watching. Every one of those conditions changes in production, and each change removes a different piece of the performance you measured.
The result is a familiar and demoralising pattern. The system that responded instantly in the boardroom takes eight seconds to load a dashboard six months after launch. Alerts that arrived immediately now trail the event by minutes. Nothing broke; the system simply met the load it was never tested against.
This article is about IoT performance as an engineering discipline — what to measure, where systems actually hit limits, and how to find those limits before customers do.
What Performance Actually Means in an IoT System
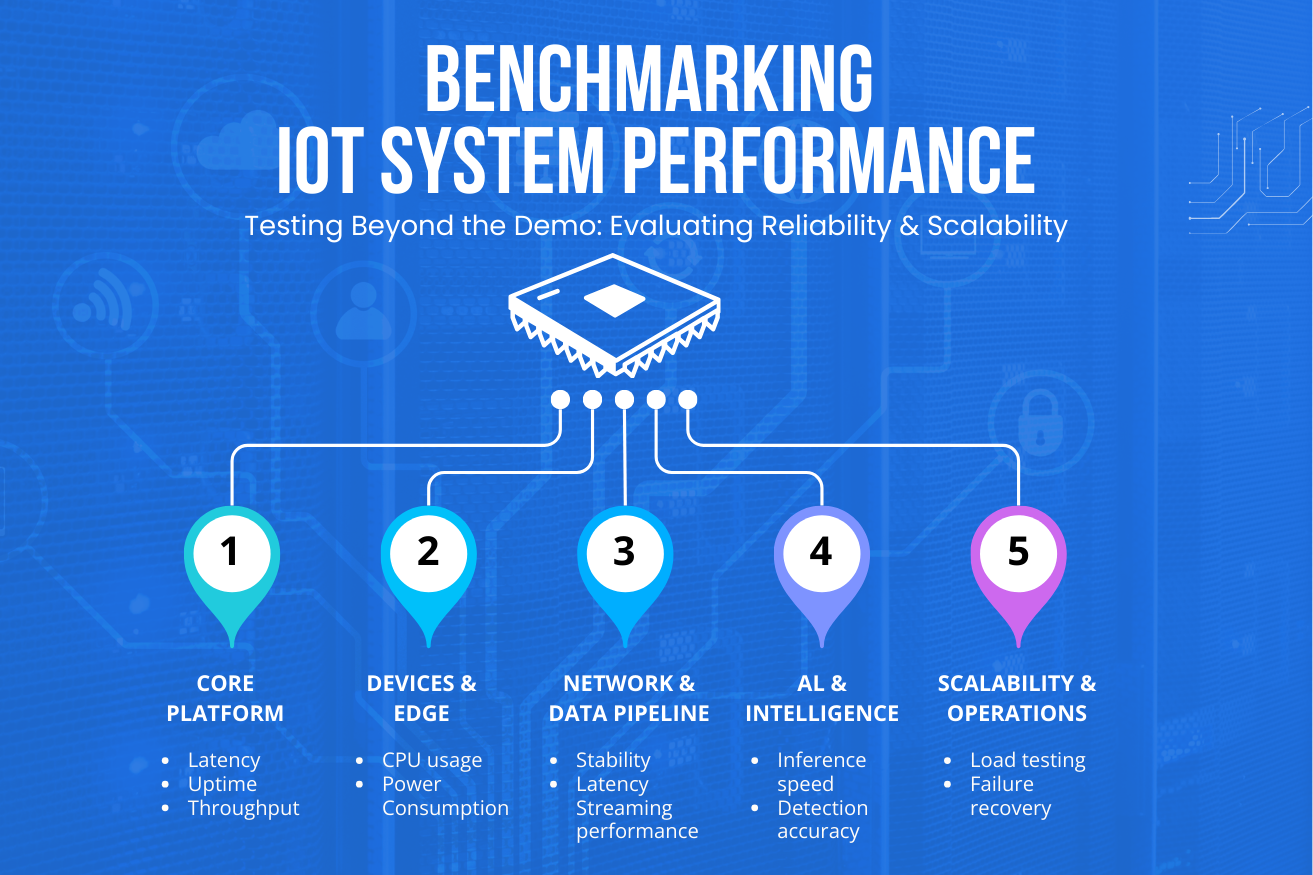
Performance in connected systems is not one number. It is five, and optimising one commonly degrades another — which is why teams that track a single metric are usually surprised by the other four.
| Dimension | What it measures | How it fails at scale |
|---|---|---|
| End-to-end latency | Event in the world to action taken | Queues build; the tail grows long before the average does |
| Ingestion throughput | Messages accepted per second | A shared bottleneck saturates and backpressure propagates |
| Query responsiveness | Time to render a view or report | Degrades as history grows, regardless of device count |
| Delivery reliability | Share of events that arrive intact, once | Retries duplicate; buffers overflow silently |
| Cost per device | Connectivity, ingestion, storage, compute | Scales linearly while value does not |
A demo exercises exactly one of these — latency, on an empty system. That is why demos are such poor predictors: they measure the dimension least likely to be the eventual constraint.
The Four Conditions a Demo Removes
Concurrency
Ten devices produce a trickle that any architecture absorbs. Ten thousand produce sustained concurrent load, and the difference is not gradual. Systems typically behave well until a resource saturates, then degrade sharply across a narrow band.
The usual culprits are a connection pool, a single-threaded consumer, a lock on a hot table, or an external API with a rate limit nobody documented. None of these are visible at demo scale because none of them are anywhere near their limit.
Accumulated history
A demo runs against an empty database. Production runs against two years of time-series data. Queries that scanned a thousand rows now scan hundreds of millions, and dashboards that felt instant become the slowest part of the product.
This degradation is invisible during development because it is a function of time rather than of load. It arrives quietly, months after launch, and it is why so many IoT platforms feel slower every quarter.
Adversarial timing
Real fleets do not behave uniformly. Devices synchronise accidentally — on the hour, at shift change, or after a regional outage ends and thousands reconnect at once.
These correlated bursts can be one or two orders of magnitude above the average rate. A system sized for mean load fails precisely when it matters most, and the failure often cascades: the ingestion backlog delays alerts, which triggers retries, which increases load further.
Imperfect inputs
Demo data is clean. Production data contains duplicates from retries, out-of-order arrivals from buffered devices, malformed payloads from a firmware revision, readings from clocks that were wrong for a week, and messages from devices you thought were decommissioned.
Pipelines that assume well-formed, in-order input spend production either crashing or, worse, silently producing wrong aggregates.
Systems do not slowly get worse under load. They work, and then they do not, over a surprisingly narrow range.
The Five Bottlenecks That Cause Most IoT Slowdowns
Measuring Performance So the Numbers Mean Something
Most IoT dashboards report averages, which is close to useless. Averages hide the failures users actually experience.
Testing at the Scale You Will Actually Reach
Load testing an IoT system means simulating devices, not users, and it needs to reproduce the behaviour that causes real failures.
- Simulate the target fleet, then double it. Virtual device clients are cheap. Find the cliff deliberately rather than discovering it in production.
- Reproduce correlated bursts. Send everything on the hour. Reconnect ten thousand devices simultaneously. This is the load pattern that breaks real systems.
- Test with realistic history. Seed the database with the volume you expect after two years, then measure query performance. Testing against an empty store proves nothing about the product’s future.
- Inject malformed and out-of-order data. Duplicates, late arrivals, bad timestamps, and unknown device IDs should all be handled explicitly and observably.
- Run soak tests for days. Memory leaks, disk exhaustion, and connection leaks only appear over time, and they are among the most common causes of unexplained production degradation.
- Test degraded rather than absent dependencies. A slow database or a rate-limited API causes more subtle damage than an outright failure, because retries and timeouts amplify the problem.
The purpose is not to prove the system works. It is to locate the point at which it stops working, so that the number is known rather than discovered.
Architectural Choices That Prevent the Cliff
Several decisions determine performance far more than any later tuning, and all of them are cheapest at design time.
- Decide at the source. Filtering and summarising on the device removes load from every downstream tier at once — the highest-leverage optimisation available in any connected system.
- Make ingestion do almost nothing. Accept, persist, acknowledge. Enrichment, analytics, and notification belong behind a queue where they can scale independently.
- Pre-aggregate on write. Compute the rollups dashboards need as data arrives, so read cost does not grow with fleet size or history.
- Set retention before launch. Decide what is kept at full resolution, what is downsampled, and what expires. Retrofitting retention onto a full database is painful and risky.
- Give devices jitter. Randomised reporting offsets and reconnection backoff prevent accidental fleet synchronisation, which is the cheapest possible protection against correlated bursts.
- Buffer at the edge. Devices that hold data during backpressure turn a capacity problem into a delay. This is the same offline-first behaviour that protects against network outages, applied to platform load.
Frequently Asked Questions
Conclusion
IoT performance problems are rarely caused by slow code. They are caused by a system meeting conditions it was never measured against — thousands of concurrent devices, years of accumulated history, correlated bursts, and messy input.
The remedy is unglamorous and effective: define performance across all five dimensions, measure percentiles end to end, test at twice the scale you expect with realistic history, and make the architectural choices that keep cost flat as the fleet grows. Do that and the demo stops being a promise the production system cannot keep.